CRYPTO Lab


Discover how the Fear and Greed Index can guide your investing in Crypto.
Crypto LAB ™ is a cutting-edge solution designed to monitor the fear and greed levels in the cryptocurrency market. Leveraging advanced AI algorithms, it analyzes posts and tweets from social networks to provide real-time insights into market sentiment. By tracking the collective emotions expressed by users, Crypto Lab helps investors gauge the overall sentiment and make informed decisions.
Stay ahead of the curve and navigate the cryptomarket with confidence using Crypto Lab!

Social Media Data
Vast amounts of social media data, including tweets, posts, and comments, are analysed by AI algorithms to gain insights into the emotions and opinions of crypto investors. It helps track two key emotions: fear and greed. Fear often arises during market downturns, causing investors to worry about potential losses and make impulsive decisions. Greed, on the other hand, emerges during bullish periods when investors become overly optimistic and may overlook risks.

AI Algorithms
AI algorithms use machine learning (ML) and natural language processing (NLP) techniques to understand the context, tone, and intention behind social media posts. They can identify keywords, emojis, and sentiment indicators to assess the prevailing sentiment accurately. By analysing language patterns, sentiment analysis algorithms can determine whether the sentiment is positive, negative, or neutral.

Valuable Insights
By monitoring fear and greed, AI can provide valuable insights into market sentiment. It helps investors and analysts understand the collective emotions and behavioural patterns that may influence crypto prices. By analysing social media data, it helps investors make more informed decisions and provides a deeper understanding of market dynamics.
Download for FREE our CryptoLab app now to stay ahead in the crypto game 🚀
2500+ Cryptocurrencies & Tokens monitored in real-time with our AI.
This list is continuously growing as our AI-powered algorithms scrape exchanges, data aggregators and social media on a daily basis and any previously unlisted coins on our platform are permanently added for users to analyse.

01.
CRYPTO Lab features
Fear & Greed Index
Fear & Greed Index of individual digital currencies, tokens and indices is a proprietary compound score, ranging from -1 (extreme fear) to +1 (extreme greed) based upon the distribution of bearish, bullish, and neutral posts from social networks. The numerical values of the index fall into five mutually exclusive rankings which provide a framework for interpreting the index:
🔴 Extreme Fear: -1.00 to -0.60
🟠 Fear: -0.59 to -0.20
🟡 Neutral: -0.19 to +0.19
🟢 Greed: +0.20 to +0.59
🟢 Extreme Greed: +0.60 to +1.00
Fear & Greed Momentum
Fear & Greed Momentum is the speed or velocity of polarity score changes in a cryptocurrency, token or index. This momentum shows the rate of change in fear & greed movement over a period of time to help investors determine the strength of the behavioural trading patterns of crypto investors. It is calculated using the formula: (Final value – Initial value) x 100%
Home
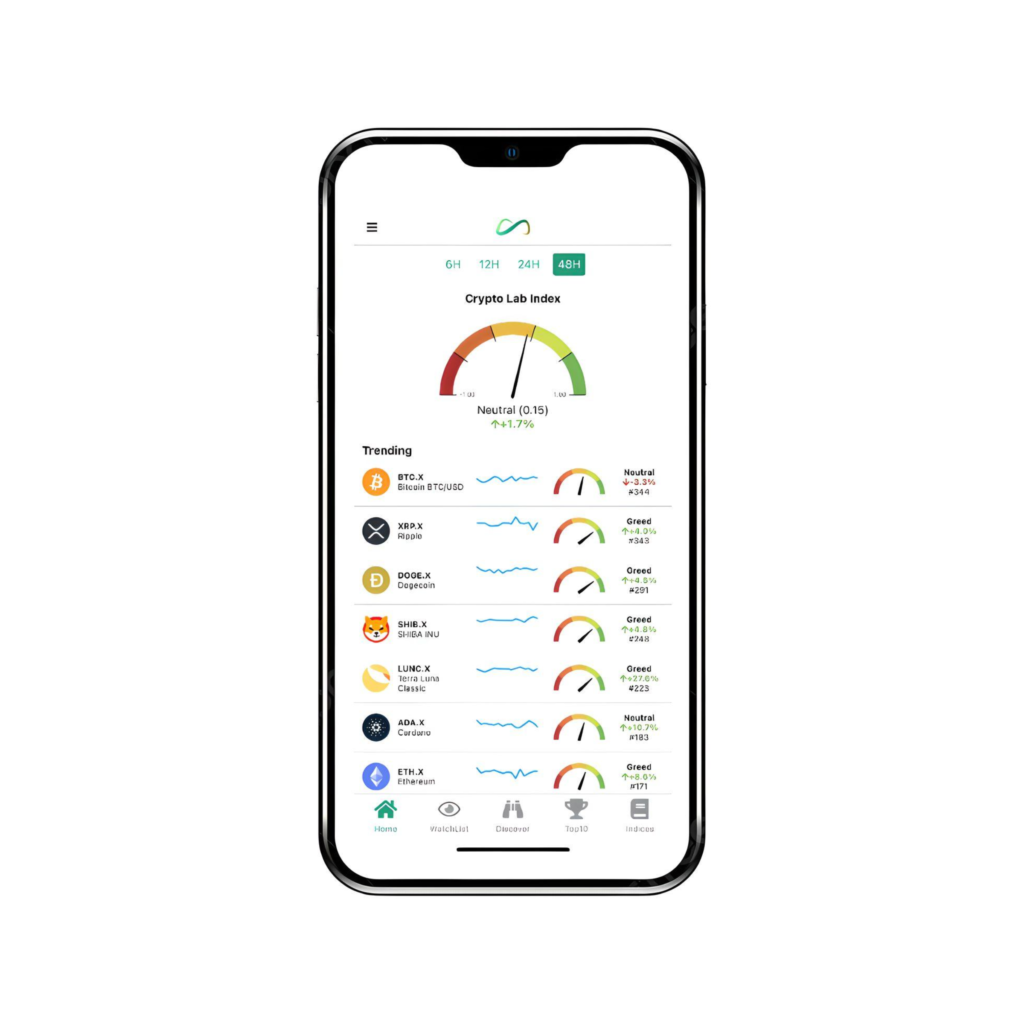
The Home section features a real-time gauge displaying the fear and greed index of the cryptocurrency market. The index is calculated based on the selected time frame, which can be 6 hours, 12 hours, 24 hours, or 48 hours. This gauge provides an indication of the overall sentiment in the market.
Below the gauge, there is a real-time list of the top trending cryptocurrencies and tokens. The trending list is determined based on the number of social media posts and tweets related to each cryptocurrency or token. This allows users to stay updated on the most talked-about digital assets in the market. Overall, the Home section of Crypto Lab provides users with valuable insights into market sentiment and the current trends in the cryptocurrency space.

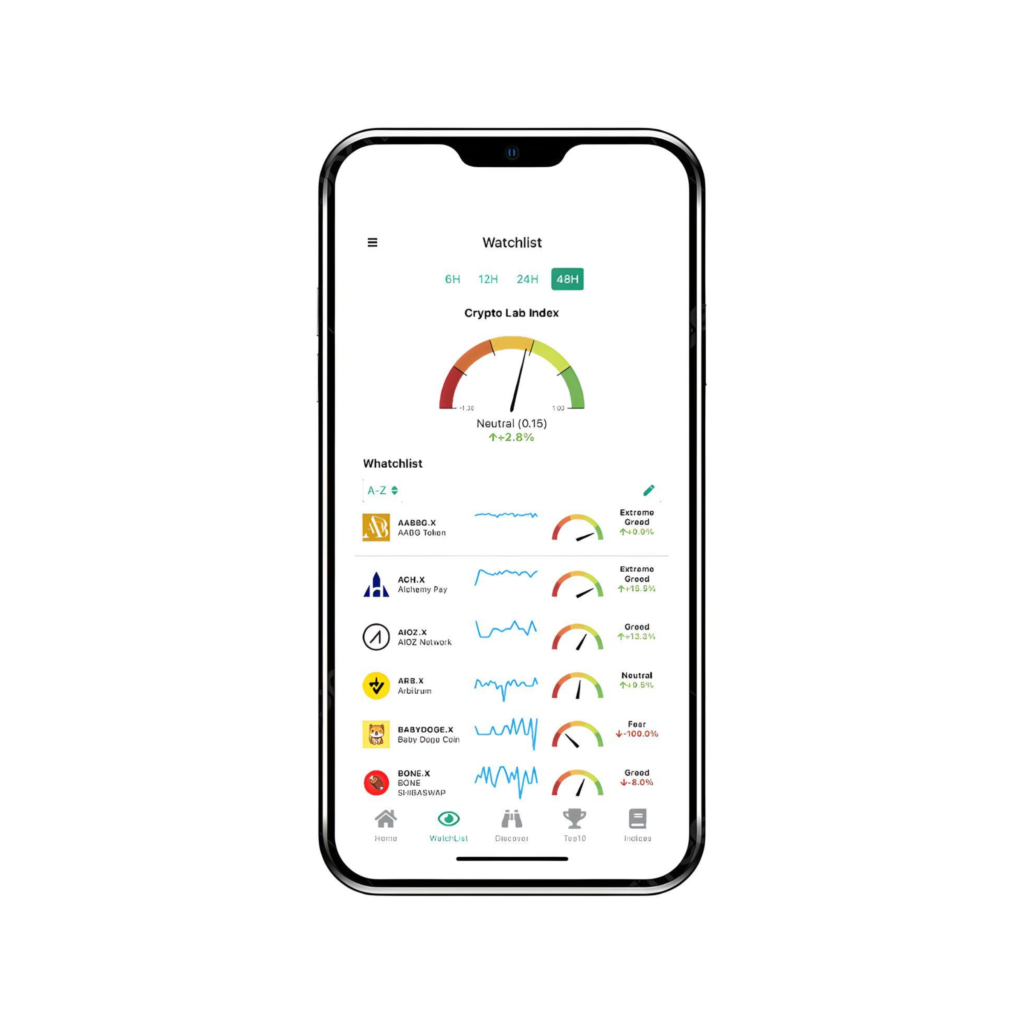
Watchlist
In the Watchlist section, users can create a personalized list of cryptocurrencies and tokens to monitor. It allows users to keep track of their favorite digital assets and stay updated on their sentiment. By adding specific cryptocurrencies or tokens to their Watchlist, users can easily access relevant information and track fear & greed changes over various time intervals such as 12 hours, 24 hours, 6 hours, and 48 hours. This feature helps users stay informed about the market movements and make more informed decisions about their investments.
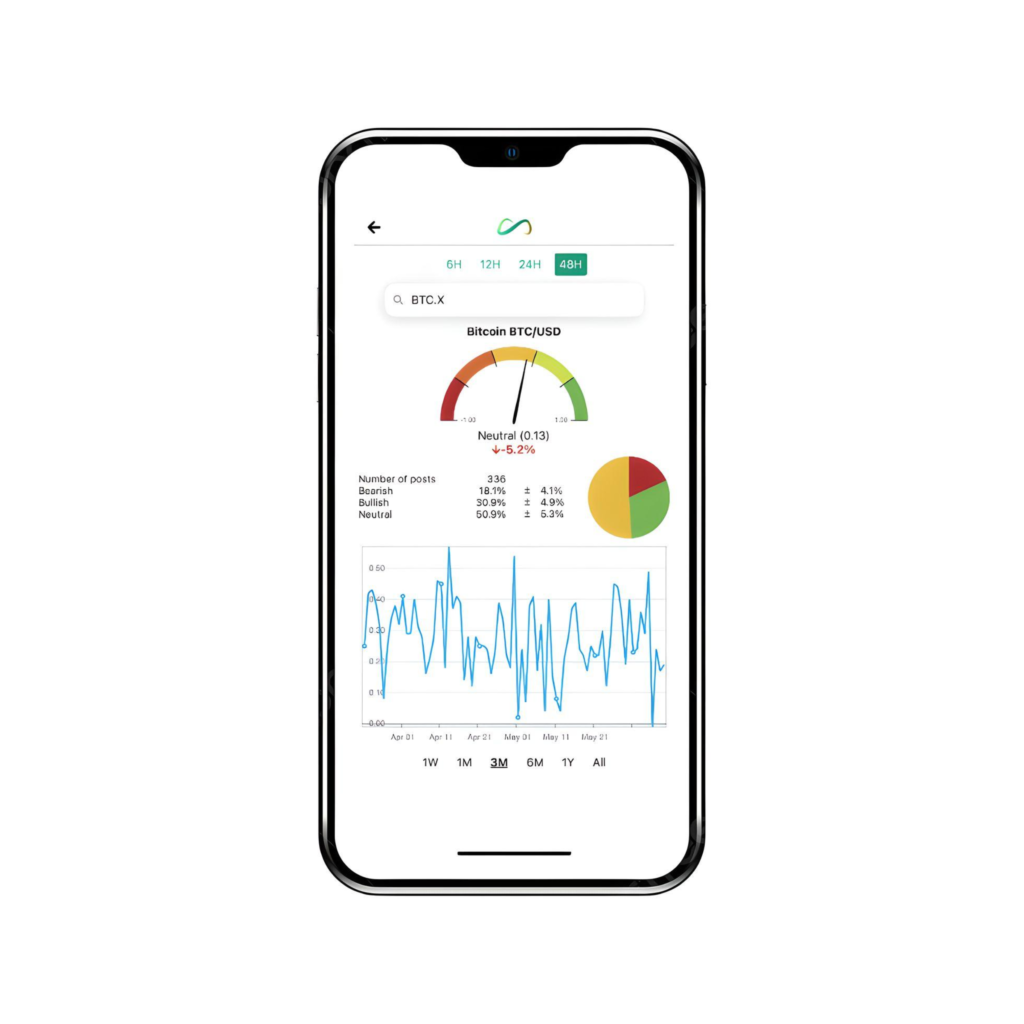
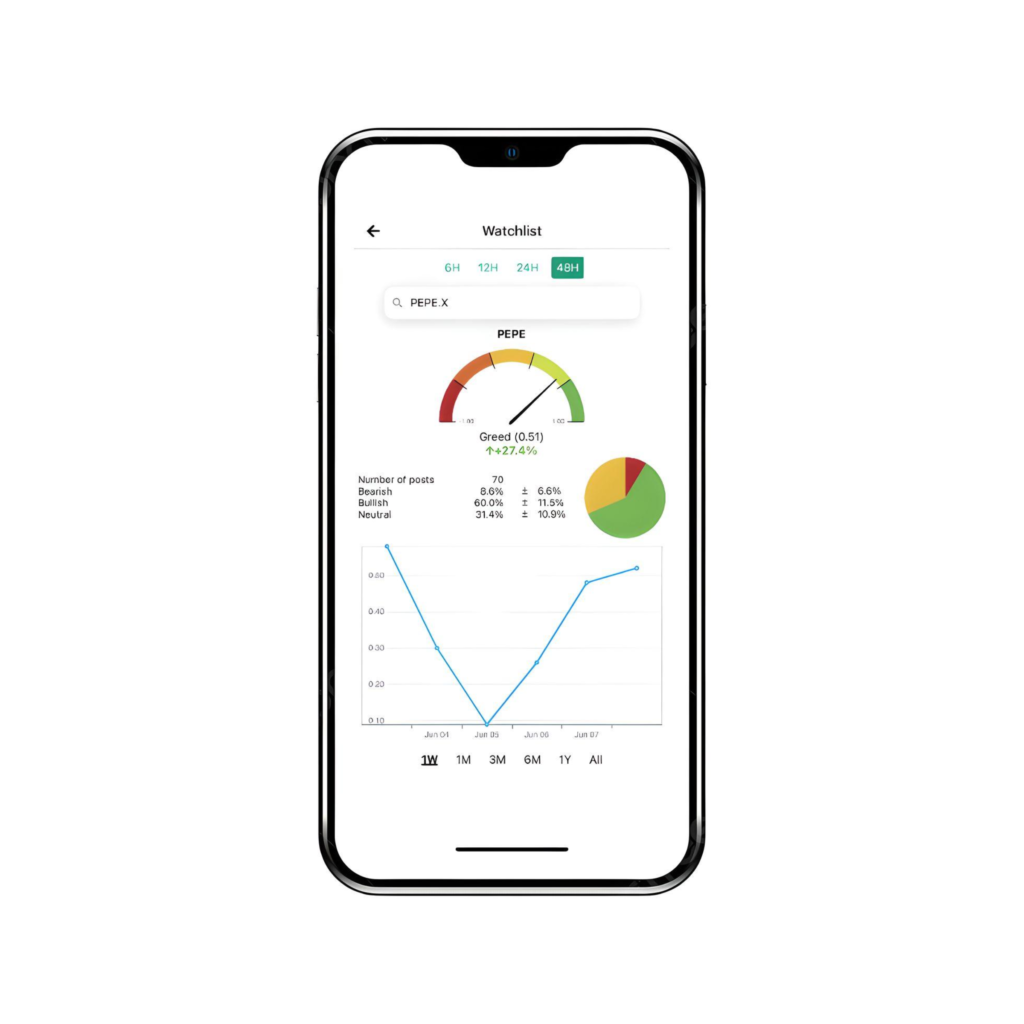
Trend & Charts
By clicking on a specific cryptocurrency, users can access detailed information about the distribution of bearish, bullish, and neutral posts/tweets collected from social networks and communities of investors and traders. Upper and lower bounds of the 95% confidence interval (margin of error) is calculated in real time according to the selected time frame. The graph shows the polarity score of each cryptocurrency aggregated on daily basis over time (1 week, 1 month, 3 months, 6 months, 1 year).
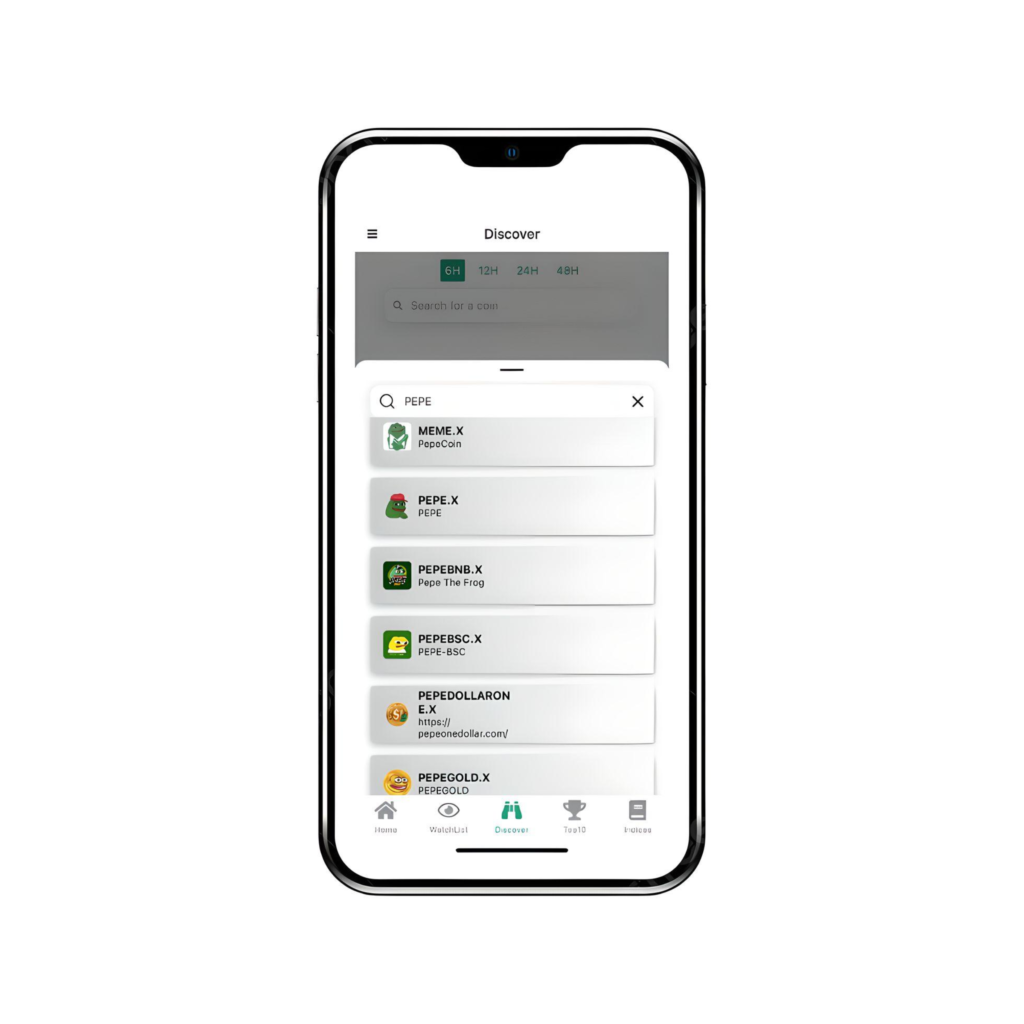
Discover
In the Discover section, users can easily search their favorite cryptocurrency or token from a list of over 2500 cryptos. This list is continuously growing as our AI-powered algorithms scrape exchanges, data aggregators and social media on a daily basis and any previously unlisted coins on our platform are permanently added for users to analyse. By entering the name or symbol of a specific cryptocurrency, the search bar helps you quickly locate the desired information.
Top 10 Fear & Greed
The “Fear” section displays the top 10 cryptocurrencies associated with fear sentiment, while the “Greed” section shows the top 10 cryptocurrencies associated with greed sentiment, based on different time frames (6 hours, 12 hours, 24 hours, and 48 hours). Overall, this feature provides users with an overview of fear and greed sentiments within the top cryptocurrencies based on different time frames, helping them stay informed about market sentiment and trends.

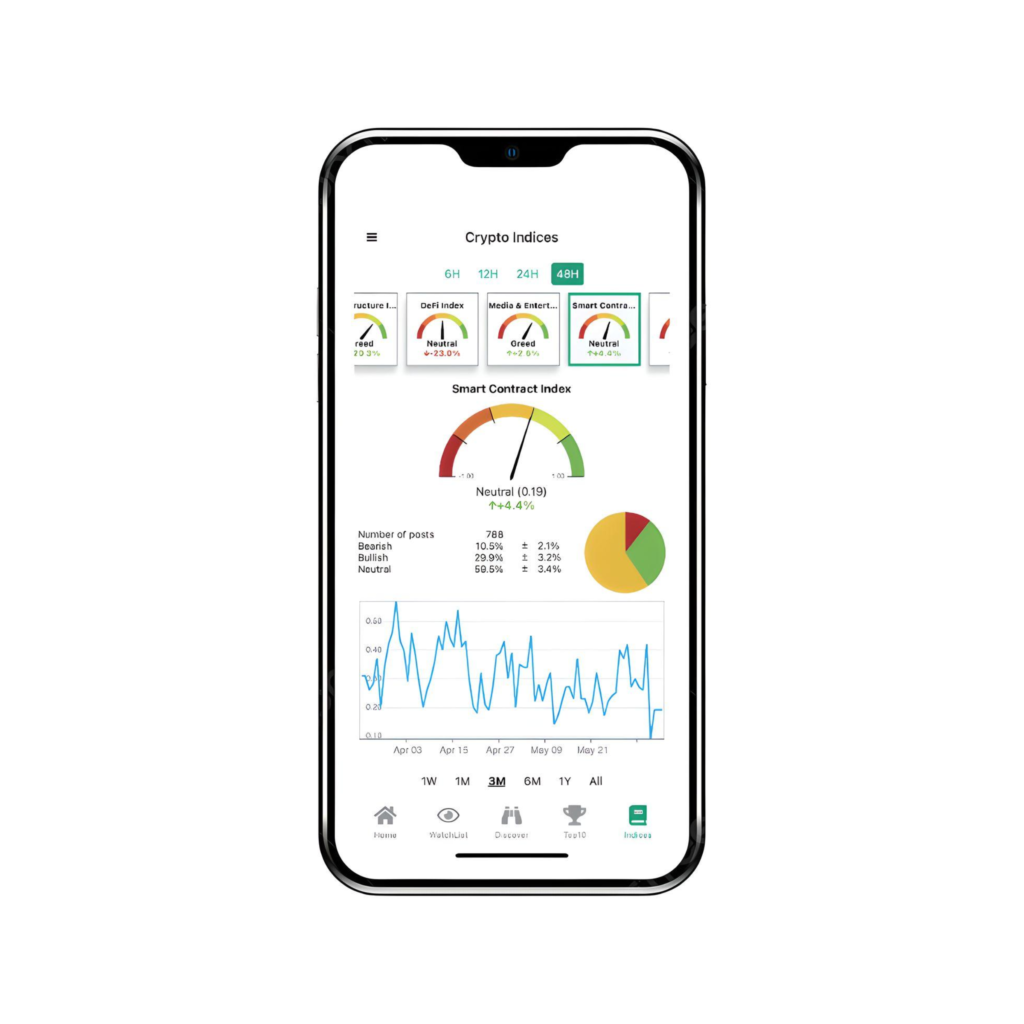
Crypto Indices
In the Indices section, users can monitor various crypto indices that represent different aspects of the cryptocurrency market. Users can select from at least nine different indices to keep track of the market sentiment. The indices provide information about the fear and greed of different sectors within the cryptocurrency market, such as DeFi, Infrastructure, Media & Entertainment, Smart Contract, Top5, Top10, Top25 and more. The graphs show the value of these indices over different time frames, such as 12 hours, 24 hours, and 48 hours, as well as longer-term periods like 1 week, 1 month, 3 months, and 1 year.
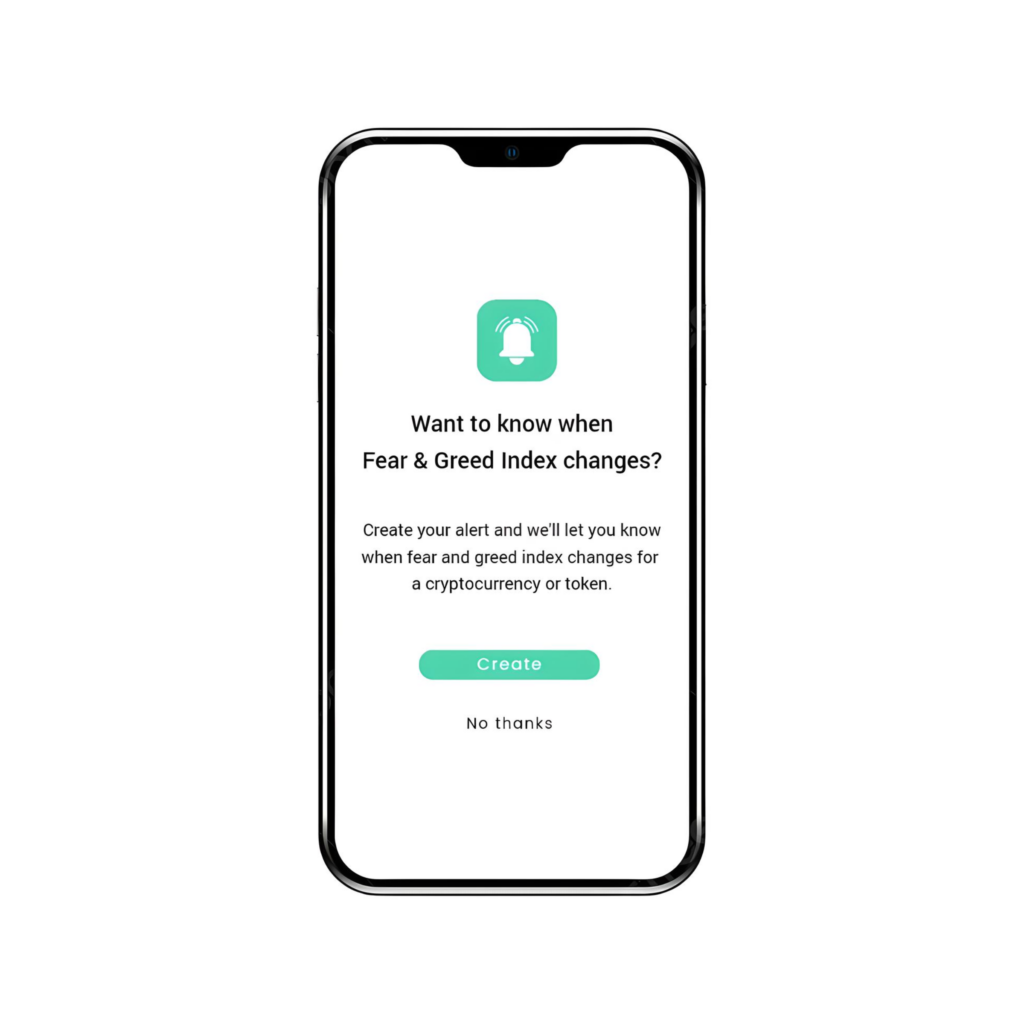
Alerts & Notifications
Alerts and notifications can be used to receive updates about fear and greed sentiment in the crypto market. Here’s a general explanation of how it works:
- User Settings: Crypto Lab provides a settings section where users can customize their alert preferences. This would include selecting the specific fear and greed indicators they want to track, such as market sentiment indexes or specific cryptocurrencies.
- Trigger Conditions: Crypto Lab has predefined trigger conditions that determine when an alert should be generated. For example, if the sentiment index reaches a certain threshold indicating extreme fear or greed, an alert would be triggered.
- Notification Delivery: Once an alert is triggered, Crypto Lab sends a notification to the user’s device. This could be in the form of a push notification, an email, or an in-app notification, depending on the user’s preferences.
- User Response: Upon receiving the alert, the user can take appropriate actions based on the information provided. They may choose to buy or sell cryptocurrencies, adjust their investment strategy, or seek further information.
02.
Crypto Indices
8 Crypto Indices regularly updated on monthly basis.
Last Update: 30/04/2024
New Crypto Indices coming soon!

Crypto Lab
Capitalization-Weighted Index
Bitcoin
Ethereum
Tether
BNB
USD Coin
XRP
Cardano
Toncoin
Dogecoin
Solana

DeFi
Decentralized Finance Index
Uniswap
Lido DAO
Aave
THORChain
Maker

Infrastructure
Infrastructure Index
The Graph
Fetch.ai
Render Token
ChainLink
Filecoin

Media & Entertainment
Media & Entertainment Index
ApeCoin
Gala
The Sandbox
Chiliz
Axie Infinity Shard

Smart Contact
Smart Contract Index
Ethereum
Cardano
Polkadot
Solana
Internet Computer
Avalanche
Cosmos
Aptos
NEAR Protocol
Polygon
Celestia
Injective
Arbitrum
Tron
Optimism
Sui

Top 5
Top 5 Crypto Index
Bitcoin
Ethereum
BNB
XRP
Solana

Top 10
Top 10 Crypto Index
Bitcoin
Ethereum
BNB
Cardano
Avalanche
Polygon
Solana
XRP
Polkadot
Chainlink

Top 25
Top 25 Crypto Index
Bitcoin
Ethereum
BNB
Internet Computer
Cardano
Polygon
Polkadot
Injective
Solana
Arbitrum
Litecoin
Uniswap
Avalanche
Chainlink
Cosmos
Ethereum Classic
NEAR Protocol
Aptos
Bitcoin Cash
XRP
Celestia
Optimism
Filecoin
Sei
Tron
03.
Technical Architecture
The diagram showcases a comprehensive process involving data collection, preprocessing, feature extraction, AI algorithms, statistical analysis, and result presentation.
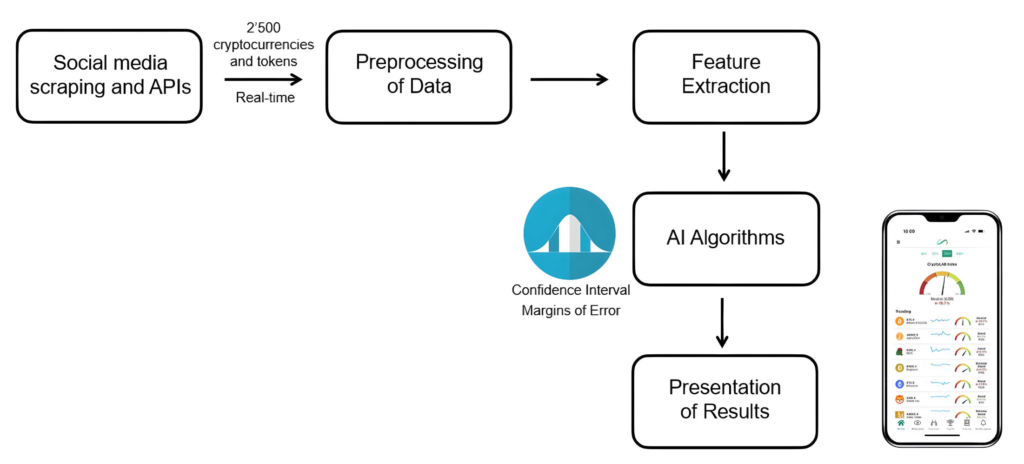
Real-time Social Media Scraping and APIs: The first step involves gathering data from social media platforms and other sources through scraping and utilizing APIs (Application Programming Interfaces). This data collection process allows the algorithm to access relevant information related to the cryptocurrencies and tokens being analyzed.
Preprocessing of Data: Once the data is collected, it undergoes preprocessing. This step involves cleaning and organizing the data to ensure its quality and suitability for further analysis. Data cleaning may include removing duplicates, handling missing values, and standardizing formats.
Feature Extraction: In the feature extraction step, relevant features or attributes are identified and extracted from the preprocessed data. These features serve as input variables for the machine learning algorithm. Examples of features in this context could include sentiment scores, keyword frequencies, or social media engagement metrics.
AI Algorithms: After feature extraction, machine learning (ML) and natural language processing (NLP) techniques are applied to the extracted features. These algorithms are designed to learn patterns and relationships within the data and make predictions or classifications based on those patterns. Various types of machine learning algorithms can be employed, such as regression, classification, or clustering algorithms.
Presentation of Results: Finally, CryptoLab presents the analyzed data, predictions, and results to the user in a meaningful and accessible way (gauge charts, trends and distribution of data related to fear and greed in the crypto market).
Request a Demo
Our experts will contact you shortly
We believe in technological innovation and understand the disruptive potential of blockchain technology and cryptocurrencies. Our mission is to help companies and entrepreneurs to innovate through our powerful crypto application development services which can provide useful and secure commercial products and services.
Request a demo today to discover how our comprehensive platform can help your company to build stronger and more sustainable financial services.
Follow @CryptoLab